Tracking your day trades, otherwise known as trade journaling, is a very beneficial practice that can help improve your trading strategy and performance over time. In this post, we will recommend the software we believe to be the best for trade journaling and what you should be tracking on your trades.
Downloading Your Trade History
First and foremost, brokers and trading platforms like ThinkOrSwim don’t have efficient ways to track your trades. They are brokers, and their primary focus is providing brokerage services. Those services don’t include formatting your trade data to make it easy to visualize and review trades out of the box. So traders must export their trade history into a spreadsheet and figure it out themselves. Most traders should be willing to invest time or money into trading journal software.
Trading Journal Services
There are a few different ways to track your day trades. One way is to use trading journal services, which can help you review your trading patterns and make necessary adjustments. Another way is to manually keep detailed records of your trades in a spreadsheet or journal.
Software for Tracking Your Trades:
Many software programs allow you to track your day trades. Some popular ones include Tradervue and Tradersync. These programs allow you to track the date, stock/instrument traded, entry and exit prices, initial stop loss, position size, profits/losses, and any notes about the trade. They also provide charts with your trades highlighted so you can see how they played out visually.
If you’re looking for an easy way to track all this information, consider using one of these software programs. It can help identify trends in your trading and improve your strategy over time.
Here are a few of those services and their current pricing:
- Tradevue: starting at $29/month
- EdgeWonk: $169/year
- TraderSync: starting at $29.95/month
Each service has its unique design and formatting, but they’re all quite similar at their core. Most have free versions or free trials, so test a few out until you find your favorite.
Our favorite is:
TraderVue
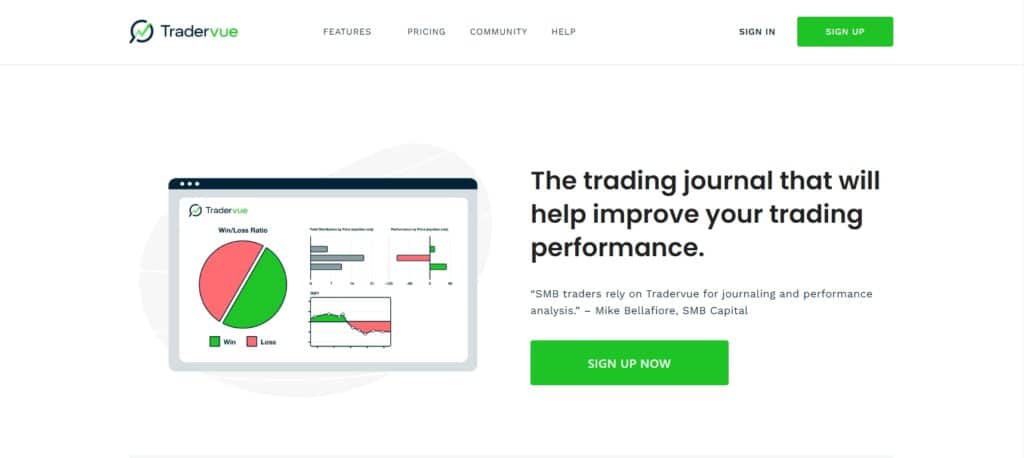
Free, paid options start at $29/mo.
Tradervue allows you to track and analyze all of your trades, as well as compare your results to other traders. It also offers customizable metrics, charting, and reports for further analysis. It can also connect to most brokerages, allowing you to import your trades quickly.
Manually Tracking Your Trades:
If you prefer to track your trades manually, record the same information mentioned above in a spreadsheet or journal. Including:
- date
- stock/instrument traded
- entry and exit prices
- initial stop loss
- position size
- profits/losses
- screenshot of the chart, including your entries and exits and any notes about the trade
Manually tracking your trades may take more time and effort, but it can still provide valuable insight into your trading patterns and how you can improve over time.
Reviewing Your Overall Trade Performance
Let’s consider a sport like professional football. The announcers are constantly spitting out stats when you’re watching the game, and those stats are based on data points, much like your trades. Once you have the data, you should start by reviewing your trading performance using key performance indicators that show us how we’re doing in our overall trading.
Here are the key performance indicators to pay attention to:
- Profit Factor: The profit factor is the ratio of the gross profit to the gross loss on a trade. In other words, it’s your reward-to-risk ratio. If you have a profit factor of 2:1, your total gross profits are two times higher than your total gross losses.
- Equity Curve: An equity curve is a graphical representation of the performance of a given stock trading system or strategy. It plots the profits or losses of a stock holding against time, typically monthly or weekly. A plotted equity curve allows traders to visualize how their system or strategy has performed over time and how it has fluctuated. The equity curve can help traders determine how well their system or strategy is performing, whether it is trending upwards or downwards, and how much risk they are taking with each trade. It can also help traders determine when to exit a losing position and cut their losses.
You could also add the Sharpe Ratio, but we feel the Sharpe Ratio is more tailored to quantitative rather than day trading. The Sharpe Ratio is a statistic used to measure how much return you’re earning per unit of risk. It’s calculated by taking the average return earned over a certain period (usually one year) and subtracting the risk-free rate of return (usually the yield on Treasury Bills). This gives you the excess return (or “alpha”) per unit of risk. The Sharpe Ratio is usually expressed as a decimal, 0.3 or 0.4. The higher your Sharpe Ratio, the better your strategy is at handling risk in the long term. Most day trading strategies have a very poor Sharpe Ratio, so don’t be discouraged if yours is low.
Digging Deeper Into Individual Trades
When reviewing your trading performance, it’s important to look at more than just your overall trade stats. It would be best if you also dug deeper into your trades to see how well you implemented your strategy. Taking notes while you’re inside your trading journal can gain valuable insights that will help you improve your trading skills. It would be best if you didn’t switch your strategy off a few individual trade reviews and let the big-picture results tell that story.
One thing to be aware of is hindsight bias throughout this process. Hindsight bias is a cognitive bias that occurs when people look back on past events and falsely believe that they could have predicted them. This often leads people to overestimate their abilities and underestimate the role of chance in events.
It’s easy to feel like you know what to do when you know the outcome. A practice that takes more effort but is highly effective in removing hindsight bias is video recording yourself and your screen. At the same time, you trade and speak your thoughts and emotions aloud for review later.
Recording a video of yourself trading can be a beneficial way to remove hindsight bias and improve your trading skills. By speaking your thoughts and emotions aloud as you trade, you’ll be able to reflect better on your actions and how you could have done better. This practice can also help you identify any emotional biases affecting your judgment.
Questions to ask yourself:
- How well did my overall strategy perform on this trade?
- How well did I execute my strategy on this trade?
- What could I have done differently to improve the outcome of this trade?
- Is there anything about this trade that is particularly good or bad?
- What lessons can I learn from this trade?
- What was the market environment like at the time of the trade?
What Was the Trade Setup?
A trade setup is a condition or combination of conditions that, when met, indicate to a trader that it is time to enter into a trade. These are also referred to as “patterns” by traders. A well-documented trade setup/pattern allows traders to quickly and easily identify potential trades, saving them time and money in the long run. By keeping track of your favorite trade setups, you can track how often they are successful and how much profit or loss they generate. This information can help you improve your trading skills and find new and profitable trade setups.
What Were My Goals For This Trade?
One of the most important things to do before entering a trade is to have clear goals. By setting specific, measurable, and achievable goals for each trade, you can increase your chances of success while minimizing risk. There are several different goals you can set depending on the type of trade you’re making. Still, some common ones include making certain percentage gains, locking in a certain amount of profit, or cutting losses short.
What Was My Risk Management Plan?
Having a risk management plan in place is crucial for any trader. This includes setting stop-loss and take-profit orders, or as we call them, fantasy orders, determining how much to invest in each trade, and diversifying your portfolio. Keeping track of how well your risk management plan worked on each trade can help you refine it and improve your overall trading performance.
Bottom Line
By tracking the details of individual trades and your overall performance stats, you can gain valuable insights that will help you fine-tune and improve your trading strategy. Happy journaling!
