
For those of you who don’t know, “death candles” are a phenomenon that can occur during day trading. Essentially, a death candle is a candlestick chart pattern that signals the potential end of an upward trend. In this blog post, we’ll discuss what death candles are, how to identify them, and what they mean for your day trading strategy.
What is a Death Candle?
A death candle is a candlestick chart pattern that signals the end of an uptrend. The first leg of the trend is bullish and trading above VWAP. It will be making higher highs with ascending volume.
This pattern gets its name from the fact that it resembles a grave with a headstone (the short green candle) and a body (the long red candle). Death candles can be used by day traders to help identify potential reversals in an upward trend.
How to Identify a Death Candle
There are four main criteria that must be met in order to accurately identify a death candle:
- The first candle or succession of candles should be big, green candles, signaling an uptrend. Green candles are candles that close higher than they open.
- The red candle should also completely engulf the body of the last few candles, signaling a potential reversal in trend.
- The volume in that red candle will be the single biggest volume intraday.
- The stock should be trading above VWAP prior to the red candle and should slam underneath VWAP. This creates panic selling since most longs will now be underwater.
Here are few examples:

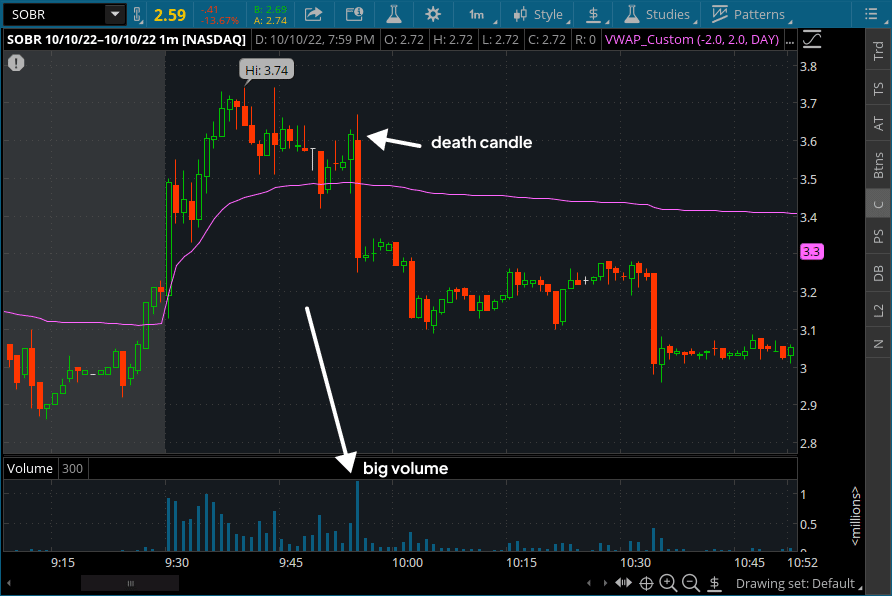
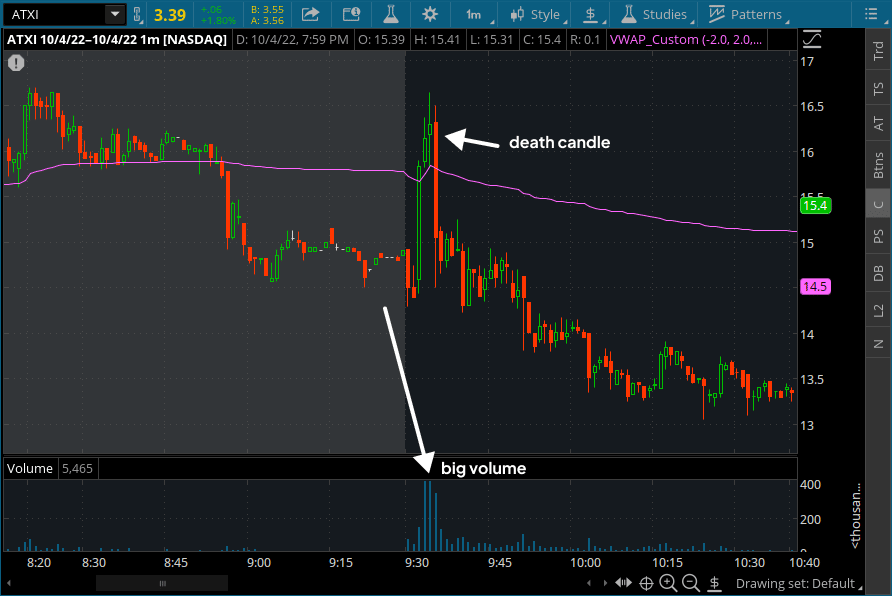
As you can see, death candles have been around for many years. It is not a new chart pattern. However, it is a pattern that led to a confirmation signal for traders like Alex to add size to a winning trade.
What Does a Death Candle Mean for Day Traders?
For day traders, death candles can be both good and bad news. On the one hand, they signal the potential end of an uptrend, which means that buyer profits might start drying up and is a great opportunity to start shorting the stock.
On the other hand, they can also be used as selling opportunities. If you see a death candle form after an extended uptrend, it might be time to take your profits off the table if you’re a buyer before the stock starts heading back down again and start shorting the stock to profit from the potential reversal.
Bottom Line
Death candles can be either good or bad news for day traders depending on how they are interpreted. If you see a death candle form after an extended uptrend, it might be time to take your profits off the table before the stock starts heading back down again. Keep an eye out for death candles and use them to help inform your trading decisions!
